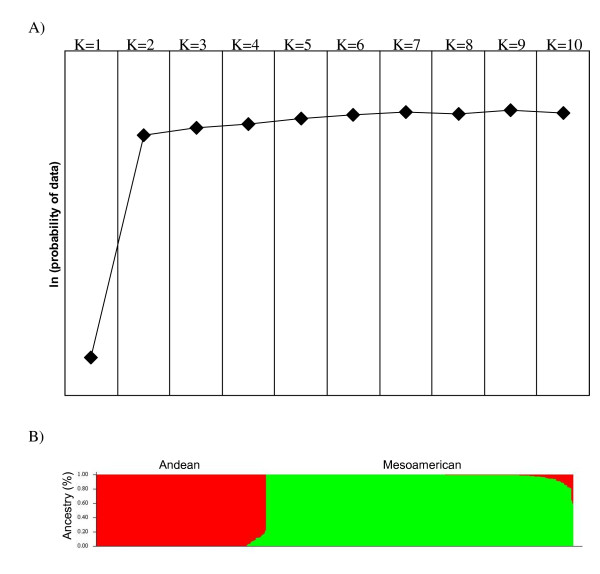
Figure 2.
Population structure estimation. A) Estimated ln (probability of the data), which was calculated for K ranges from 1 to 10; B) Estimated population structure at K = 2. Each individual is represented by a thin vertical line, which is partitioned into 2 coloured segments that represent the individual membership to the 2 clusters.

