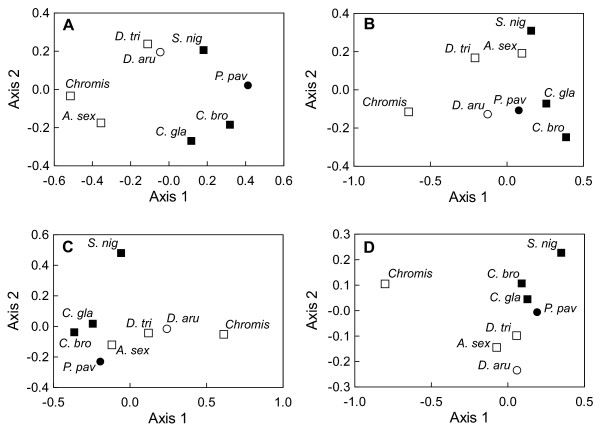
Figure 3.
Similarity of allometric trajectories. Nonmetric multidimensional scaling plots on the matrix of pairwise angles among allometric trajectories for the (A) neurocranium, (B) the «suspensorium and opercle» unit, (C) the mandible and (D) the premaxilla. For each scatter plot, Kruskal Stress values are below 0.05. Different icons are used to illustrate the diet of each species: white square, zooplanktivorous; black square, algivorous; white circle, omnivorous feeding mainly on planktonic and benthic animal preys; black circle, omnivorous feeding mainly on filamentous algae. See Table 1 for abbreviations of the species.

