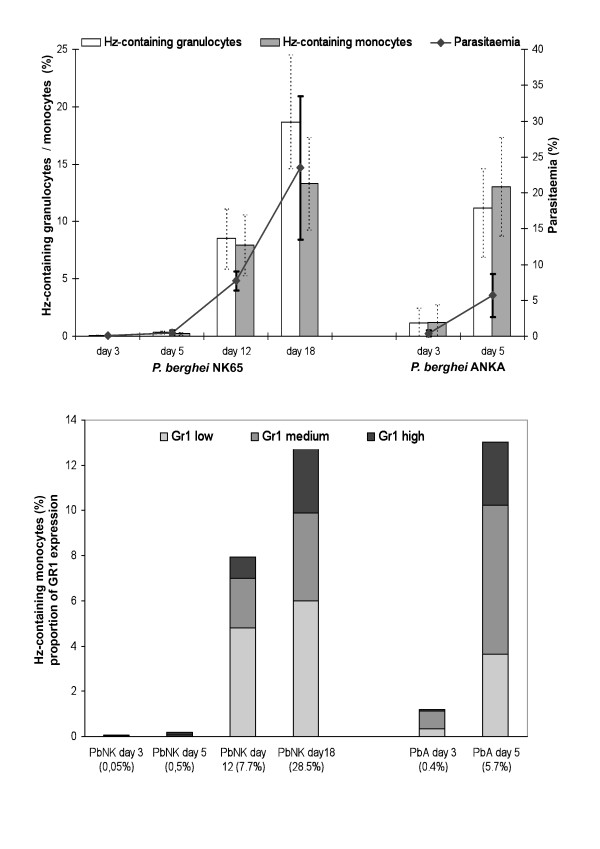
Figure 6.
Haemozoin containing leukocytes in two different mouse models of malaria. Groups with five C57BL/6 mice where infected with P. berghei ANKA (PbA) or with P. berghei NK65 (PbNK). Blood was drawn on day 3, 5 12 and 18 and analysed after labelling with with anti-CD11b and Gr1. Analyses and gating strategy is described in the text (additional file 1). Percentage of Hz-containing monocytes and granulocytes (top graph) as well as parasitaemia are mean values per group (± one SD). Open bars = Hz-containing granulocytes; grey bars = Hz-containing monocytes. Uninfected controls had no Hz-containing leukocytes and are not shown. Bottom graph shows proportion of different Gr1 expression (high = black, medium = grey; and low = light grey) of Hz-containing monocytes, shown in top figure. Percentages on x-axis represent mean parasitemia. Mice with PbANKA infection were sacrificed on day 5.

