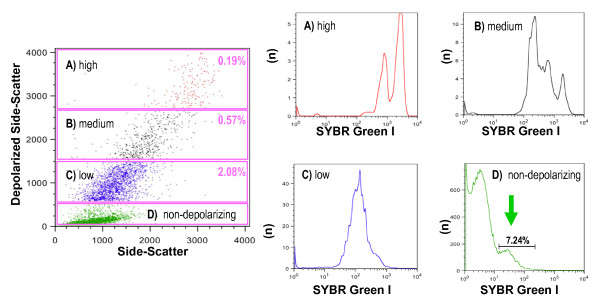
Figure 8.
Degree of depolarization corresponds to different developmental stages of P. berghei ANKA. Blood from a C57BL/6 mouse with a parasitaemia of 9.7% as determined by microscopy. Top plot shows several populations with decreasing degree of depolarization (A, B, C). Gate D shows low or non-depolarizing events. The four histograms show the number of events (n) and their fluorescence intensity (x-axis) of SYBR Green I, representing the DNA content. Gate D contains a population of 7.24% (arrow), likely including ring-forms with little Hz and thus very low or no depolarization.

