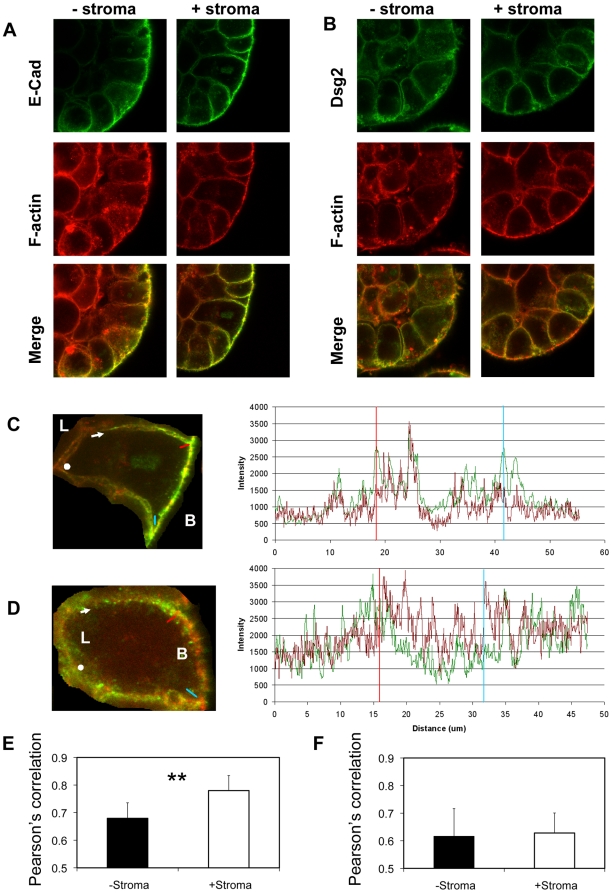
Figure 3. Stroma enhances E-cadherin and F-actin co-localisation.
(A and B). 7 day old 3D BPH-1 acini were immunostained for E-cadherin (A, green) or Dsg2 (B, green) and F-actin (red). (C and D). High magnification analysis of co-localisation within single cells indicated that E-cadherin and F-actin (C) co-localised in intense patches along the basolateral membranes, whereas Dsg2 and F-actin did not (D). Using Volocity software, a line was drawn from the arrow to the red mark, blue mark and to the spot in order to measure the green and red fluorescent intensity along the basolateral membrane to produce a graph of fluorescent intensity versus distance from the arrow (with the blue and red markers included for reference). The patterns of red and green fluorescent intensity closely matched for E-cadherin and actin indicating co-localisation, but not for Dsg2 and F-actin. For E-cadherin and F-actin yellow patches of co-localisation clearly correlated with the simultaneous peaks of red and green fluorescence. L = luminal side of cells, B = basal edge. (E and F). Comparison of F-actin co localisation with E-cadherin (E) or Dsg2 (F), measured by Pearson's correlation coefficient of acini grown with or without stroma. A paired t-test was used to calculate significance. Each experiment consisted of 10 images. The experiment is typical of three separate stromal cultures, **p<0.005.

