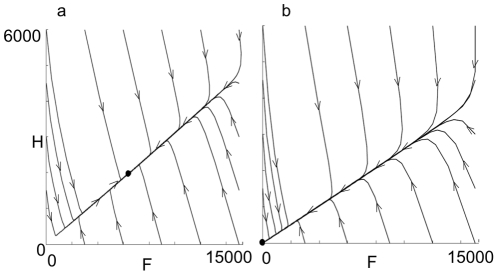
Figure 3. Phase plane diagrams of solutions to the model for different values of m.
Each line on the diagrams represents a solution trajectory, giving the
number of foragers F and the number of hive bees
H. As time t increases the
solutions change along the trajectory in the direction of the arrows. In
(a) m = 0.24 and the populations
tend to a stable equilibrium population, marked by a dot. In (b),
m = 0.40 there is no nonzero
equilibrium and the hive populations collapses to zero. Parameter values
are L = 2000,
 = 0.25,
 = 0.75 and
w = 27 000.

