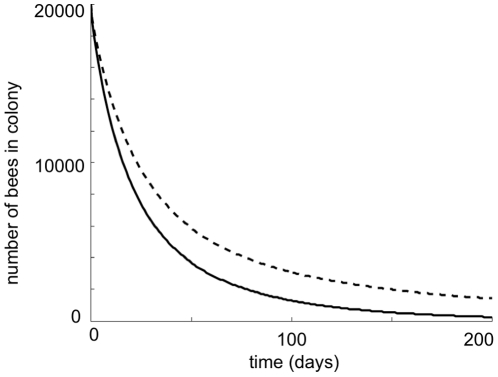
Figure 4. The effect of inefficient precocious foraging on population decline.
This plot shows the time course of colony decline when all foragers
perform equally well (dashed line) and when precocious foragers die
faster than mature foragers (solid line). The effect of precocious
foraging is modeled by replacing the death rate m by
m = ml
R2/(
 2+R2)
whenever R<0 where R is the
recruitment rate of foragers given in eqn (4). Parameter values are
L = 2000,
 = 0.25,
 = .75,
w = 27 000,
ml = 0.6 and
 2 = 0.059.

