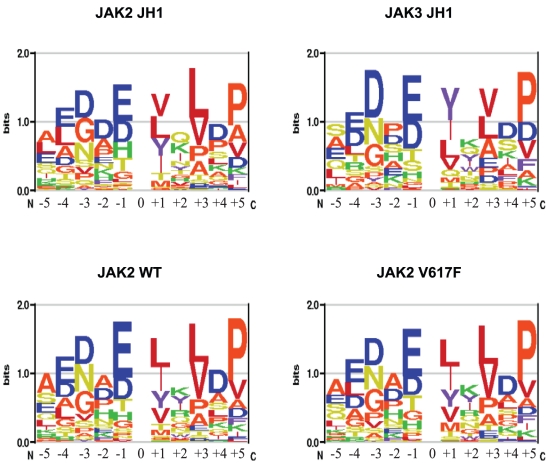
Figure 3. Sequence recognition motifs.
The motif was obtained by expressing Vmax/Km for each peptide as a fraction of the total Vmax/Km obtained on the chip and entering the weighted contribution into the enoLOGOS program. The height of the stack of single amino acid letters indicates the relative entropy of the site. The size of each letter indicates its preference at the position relative to the phosphorylation site between −5 and +5.

