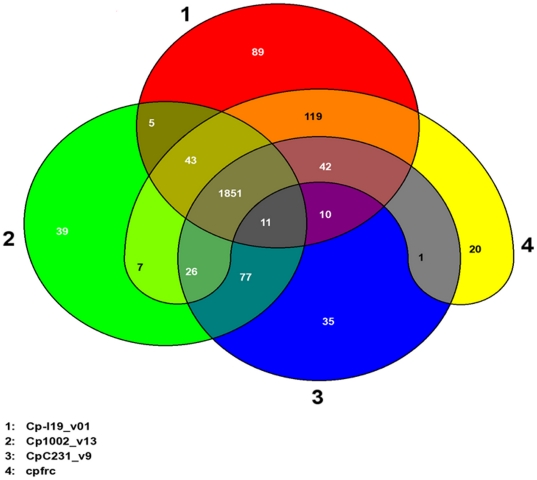
Figure 3. Venn diagram illustrating the three genomic categories of four Corynebacterium pseudotuberculosis strains: core, accessory and extended genome.
Data obtained from the comparison of the predicted proteomes of four C. pseudotuberculosis speices in the EDGAR program (Blom et al., 2009). In red: Cp-I19; green: Cp1002; blue: CpC231 and yellow: CpFRC41. The remaining colors illustrate the shared genes among strains. The numbers within the forms indicate the number of shared genes.

