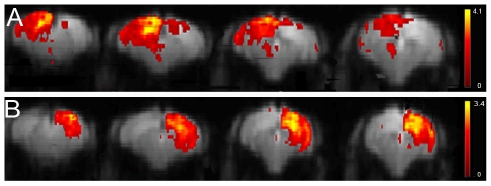
Figure 3. Cortical functional connectivity maps resulting from 15 components ICA (GIFT) of mouse rsfMRI.
The figure shows 4 slices of 2 mean components, demonstrating the separation in the left (A) and right cortex (B). The spatial colour-coded z-maps (axial) of these components are overlaid on the GE-EPI image. A higher z-score (yellow) represents a higher correlation between the time course of that voxel and the mean time course of this component.

