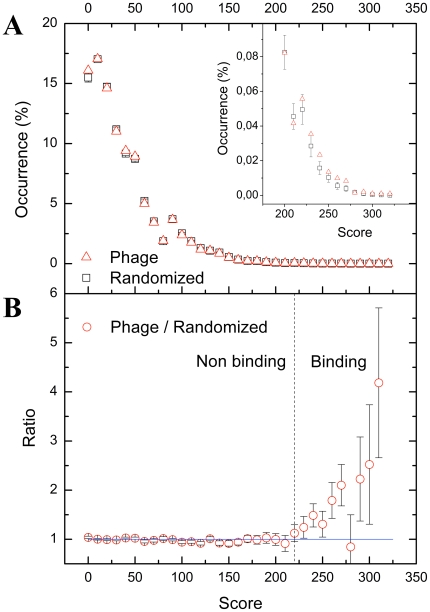
Figure 6. Statistical analysis for threshold score determination.
(A) Density distributions of scores. Dashed baseline is derived from average values from 1000 randomized score sets (see Methods) while continuous line represents the in vitro selected scores. In the high score region (inset), the phage-selected set yields higher frequencies than the randomized baseline set. (Error bars show standard deviation of frequencies in the randomized sets). (B) The ratio of the density distribution functions of the scores. Above a threshold score value of 220 predicted DYNLL-binding motif frequencies exceed stochastic frequencies obtained from the randomized set, therefore their ratio exceeds one.

