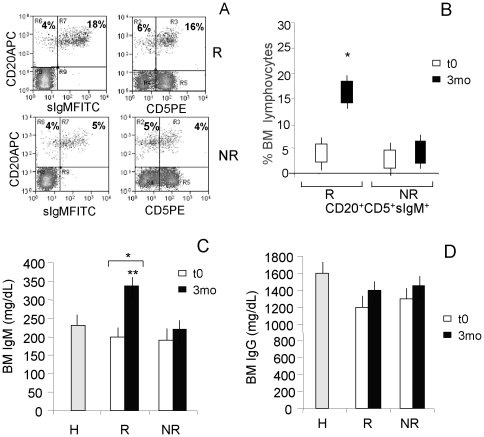
Figure 1. Increased CD20+CD5+sIgM+ lymphocytes and IgM plasma concentrations in the BM of CML patients upon imatinib therapy.
BM samples were drawn after 3 mo of therapy (A–D) or at the time of diagnosis (t0) (B–D). Panels A and B: cells isolated from BM were stained with the APC-conjugated anti-CD20, followed by the FITC-conjugated anti-IgM mAb, and/or the PE-conjugated anti-CD5 mAb. Samples were run on a Cyan ADP cytofluorimeter, gated on lymphocytes and to exclude non viable cells and debris, and results expressed as log far-red fluorescence intensity (a.u.) (A) vs. log green fluorescence intensity (left dot plots) or log red fluorescence intensity (right dot plots), or percentage of positive cells (B). Panel A: R (upper dot plots) and NR (lower dot plots) patient specimens at mo 3; numbers in upper left (UL) and upper right (UR) quadrants indicate CD20+sIgM− (UL) or CD20+sIgM+ (UR cells (left dot plots) and CD20+CD5− (UL) or CD20+CD5+ (UR) cells (right dot plots). Panel B: BM CD20+CD5+sIgM+ cells at t0 and mo 3 in R and NR patients. Mean±SD from 32 R and 8 NR patients. * p<0.001 vs NR and t0. Panels C and D: IgM (C) and IgG (D) content was measured in BM plasma samples from R or NR patients or 10 healthy (H) donors by ELISA using a commercial kit containing specific antibodies against these Ig classes and HRP-streptavidin conjugated secondary antibodies. Following development with ABTS, plates were read at OD405, referred to a standard curve and results expressed as mg/dL. Mean±SD from 32 R and 8 NR patients. * p<0.001 vs t0; ** p<0.001 vs NR.

