
Figure 3.
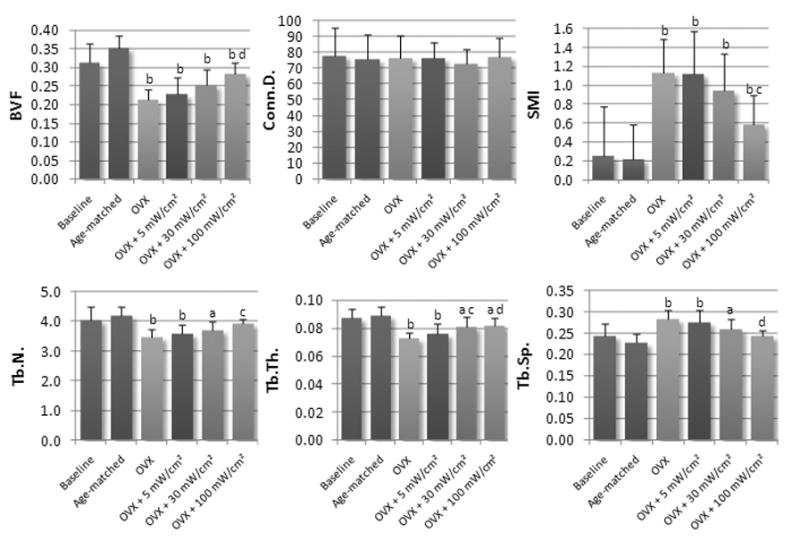
Mean values of microstructural parameters at the L5 vertebra for experimental and control groups. Values are reported as mean ± SD. (Note: a = p<0.05 vs. age-matched control, b = p<0.001 vs. age-matched control, c = p<0.05 vs. OVX control, d = p<0.001 vs. OVX control.)