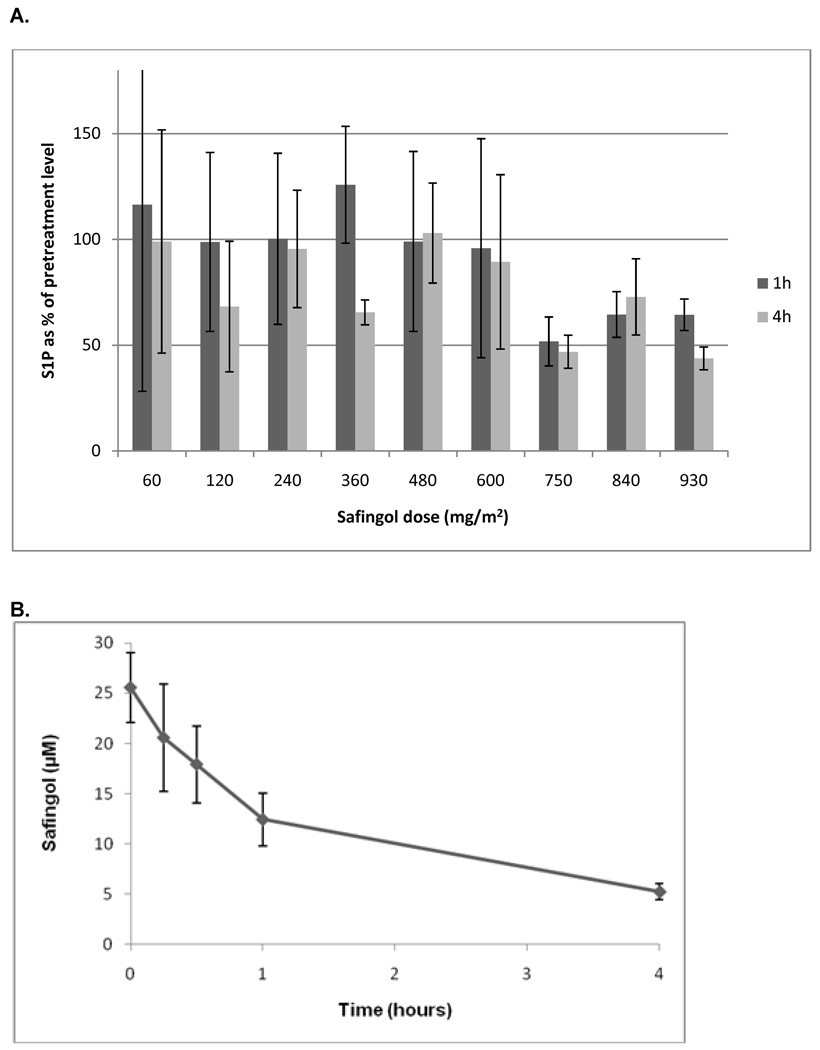
Figure 2.
(A) Pharmacodynamics of sphingosine-1-phophate (S1P) in peripheral blood. The mean S1P levels 1 hour and 4 hours after safingol treatment are shown, with patients grouped by safingol dose cohort. S1P levels are normalized to the pre-treatment S1P levels for each cohort with standard error bars shown. (B) Safingol plasma concentration over time for the patients treated at or near the MTD. Safingol doses of 750–930 mg/m2 were administered. Plasma levels were measured beginning at the end of safingol infusion (time = 0).

