
Figure 1.
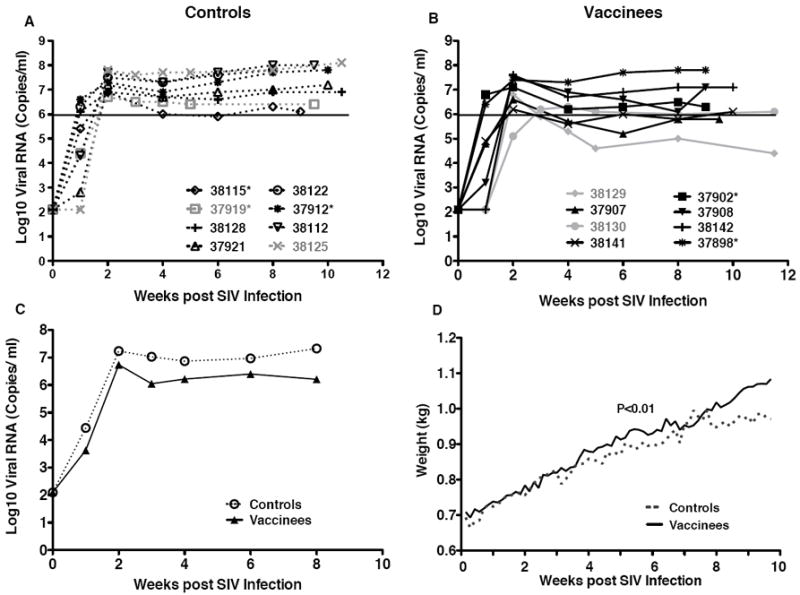
Plasma viremia and weight gain. Panels A and B show the longitudinal SIV viral levels in the plasma of unvaccinated and vaccinated macaques, respectively. Each symbol depicts an individual animal. The animals that were given a second round of challenges are shown in gray. Mamu A*01 positive animals are marked with an asteriks. Data are shown in relation to weeks post-infection (x-axis), and therefore all animals start at week 0. The black line marks the lower limit of SIV replication (10ˆ6) at viral set point measured in unvaccinated macaques. Panel C: Geometric means of SIV virus levels in unvaccinated (open symbol, dashed line) compared to vaccinated macaques (closed symbol, solid line) in the first 8 weeks after SIV infection. Panel D: The average weight gain for unvaccinated (dashed line) and vaccinated macaques (solid line) after SIV infection. The P value of <0.01 was obtained by regression analysis.