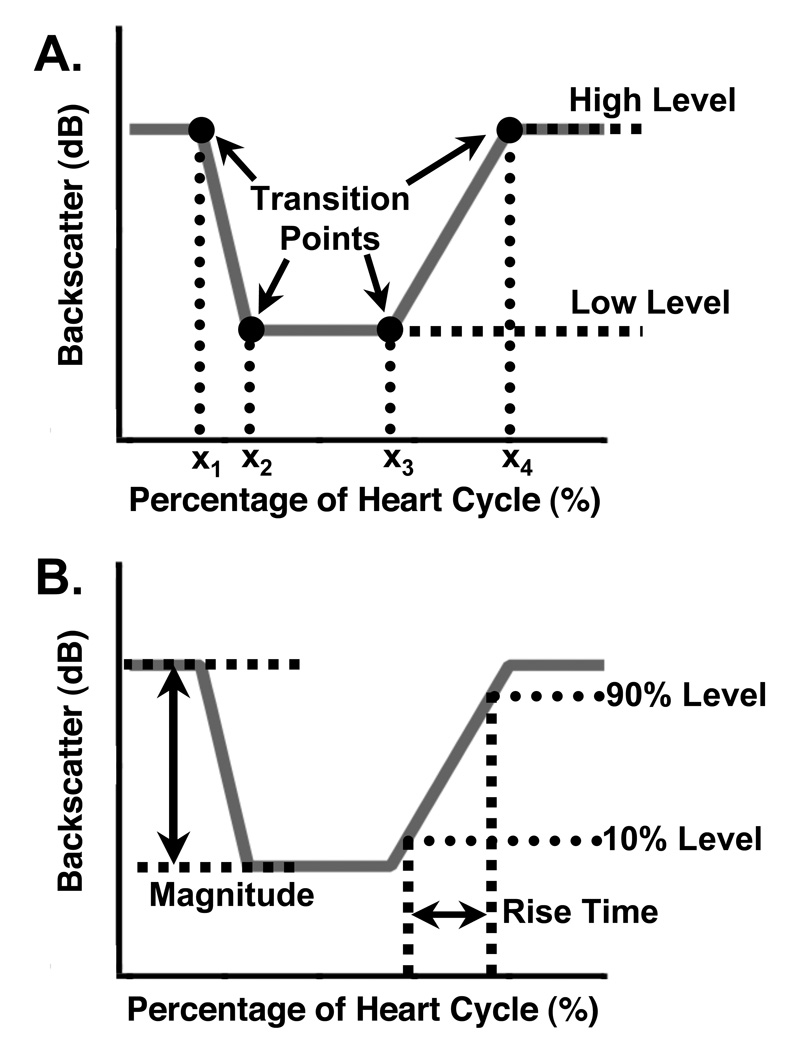
Figure 2.
Panel A (top): Schematic of a model cyclic variation waveform and the parameters used to characterize it. The high and low amplitude levels determine the magnitude, and the four transition time parameters (x1, x2, x3, x4) mark the locations where the line segments join. Given a set of values for these six parameters, the model waveform (shown in gray) can be constructed. Panel B (bottom): Illustration of the pulse parameters derived from a model cyclic variation waveform. The magnitude is the difference between the high and low levels, and the rise time is the time taken to go from 10% of the magnitude to 90% of the magnitude on the rising edge. The slew rate is the difference between the 90% level and the 10% level, divided by the rise time.

