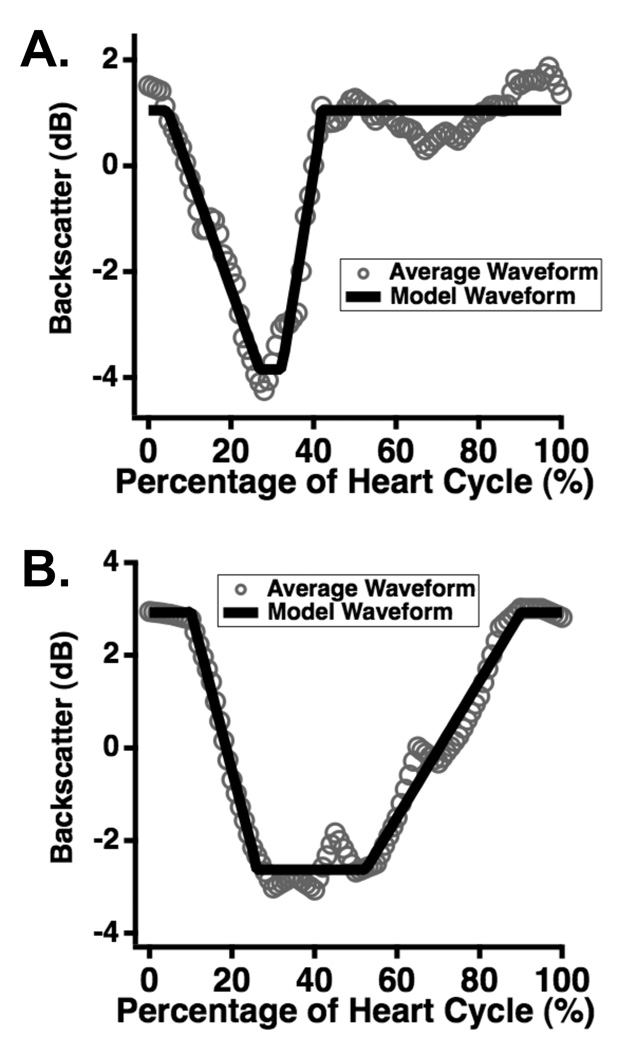
Figure 3.
Representative results for models of acquired cyclic variation data. The data, consisting of backscatter averaged over five heart cycles, are shown in gray circles; the models are shown in solid black lines. The flexible nature of the model allows good representation of both narrow (Panel A) and wide (Panel B) waveform data.

