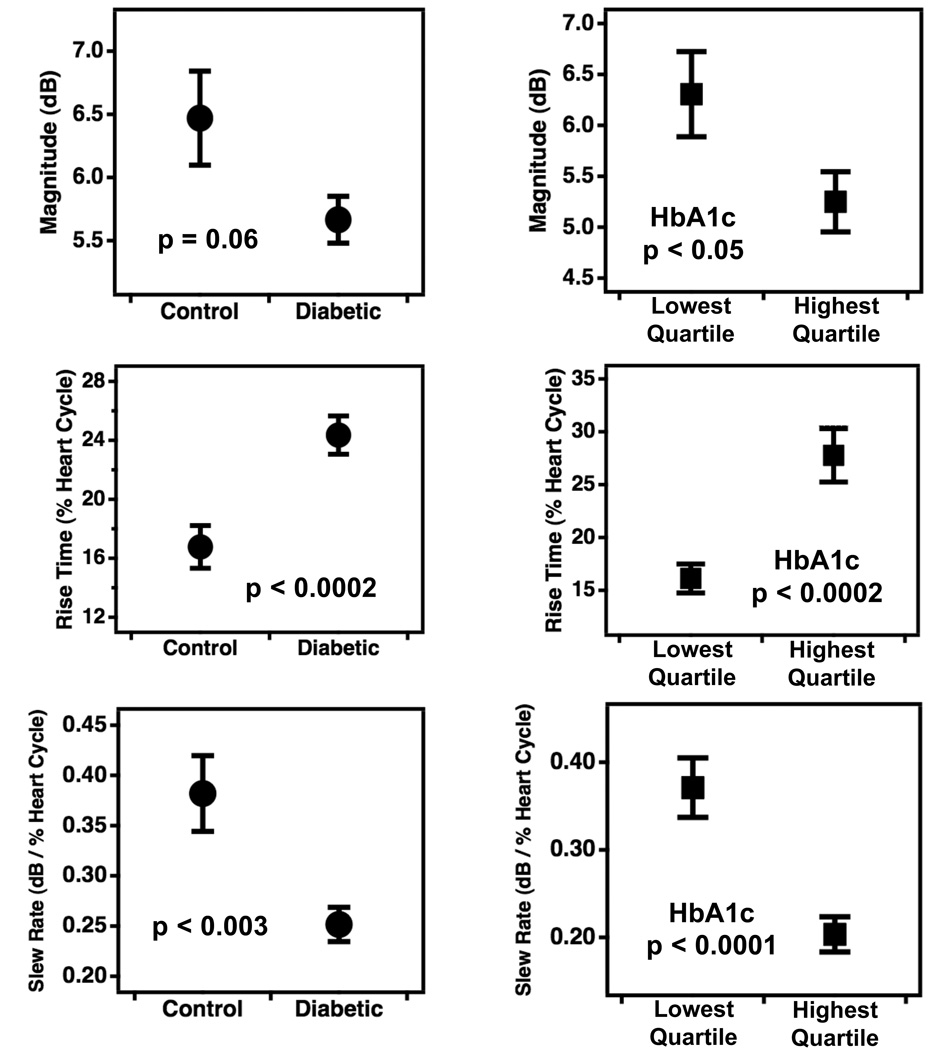
Figure 4.
Differences in the magnitude, rise time, and slew rate of the cyclic variation of backscatter from myocardium among the two subject groupings. Differences between normal control and type 2 diabetic subjects are shown in the left panels, and those between the highest and lowest quartiles of subjects grouped by glycated hemoglobin (HgA1c) are shown in the right panels. Data are presented as means ± standard errors. Corresponding p-values determined by two-tailed t-tests are included in each panel.

