
Figure 8.
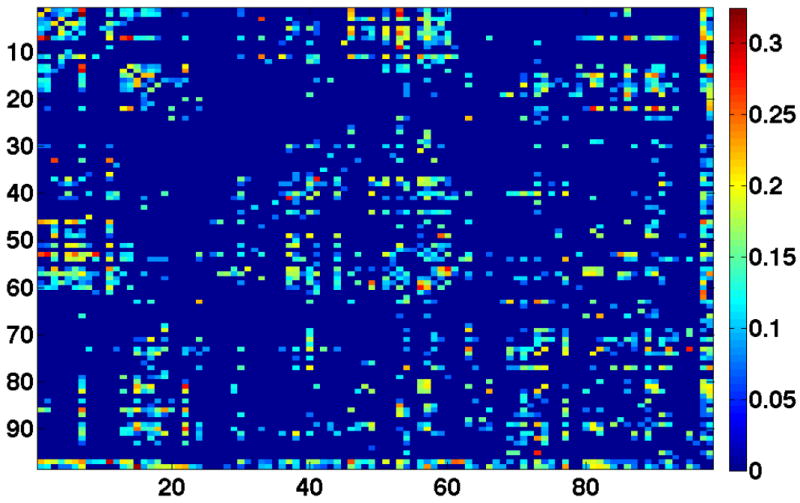
Matrix showing the statistically different connections for FE patients. Significance increases from blue (no connection) to red.
Official websites use .gov
A
.gov website belongs to an official
government organization in the United States.
Secure .gov websites use HTTPS
A lock (
) or https:// means you've safely
connected to the .gov website. Share sensitive
information only on official, secure websites.
Matrix showing the statistically different connections for FE patients. Significance increases from blue (no connection) to red.