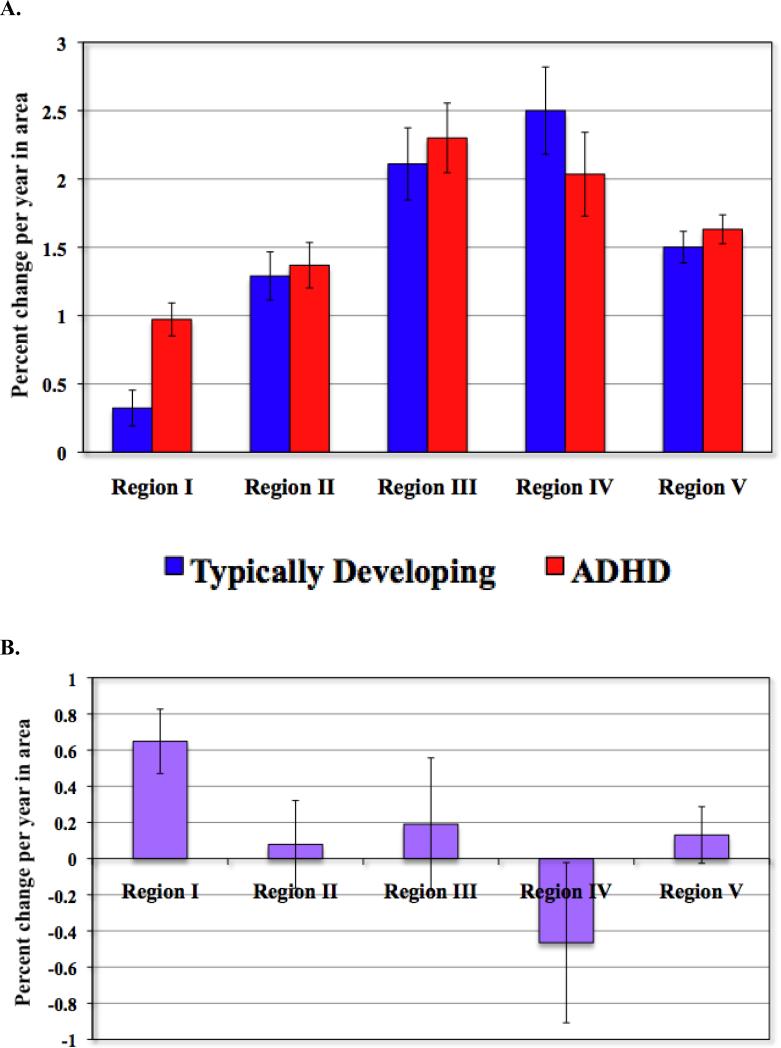
Figure 3.
A. Estimated growth rates in right handed participants by diagnosis. Bars indicate estimated percent change per year in area. Lines indicate ± SE.
B. Difference in annual percentage growth rates between right-handed participants with ADHD and typically developing controls. Bars indicate estimated percent change per year in area. Lines indicate ± SE.

