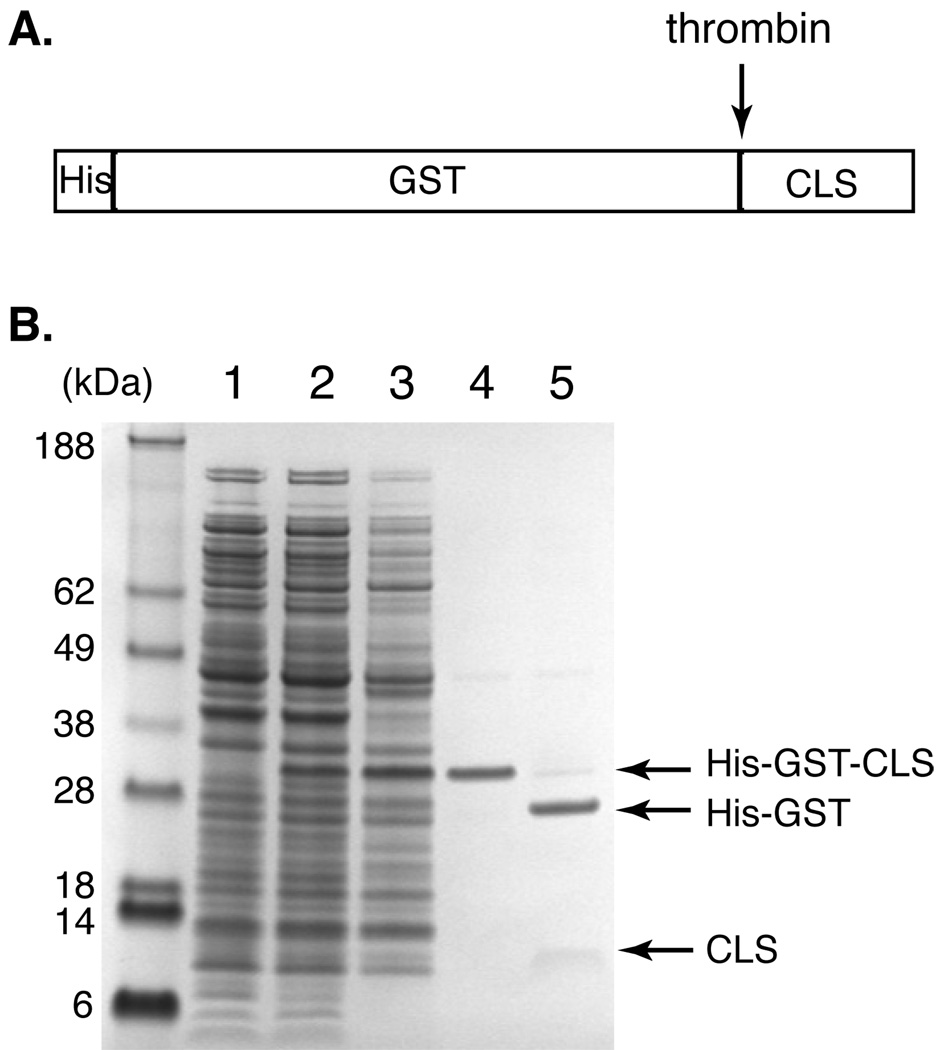
Figure 1. Anomalous migration of CLS (C-terminal fragment of L-selectin) in SDS-PAGE revealed during CLS purification.
(A) Diagram showing the domain structure of His-GST-CLS fusion protein. A thrombin-cleavage site is placed between the His-tagged GST domain and CLS. (B) A SDS polyacrylamide gel depicting expression and purification of CLS, revealing its slow electrophoretic rate. Molecular weight markers are shown on the left labeled with corresponding sizes in kDa. Lane 1: E. coli whole cell lysate before IPTG induction; 2: cell lysate after IPTG induction; 3: solubilized inclusion body from the cell lysate; 4: His-GST-CLS fusion protein eluted from the Ni-NTA column; 5: thrombin cleavage of the fusion protein. Note that CLS is more diffuse in the gel and does not stain very well by colloidal Coomassie blue.

