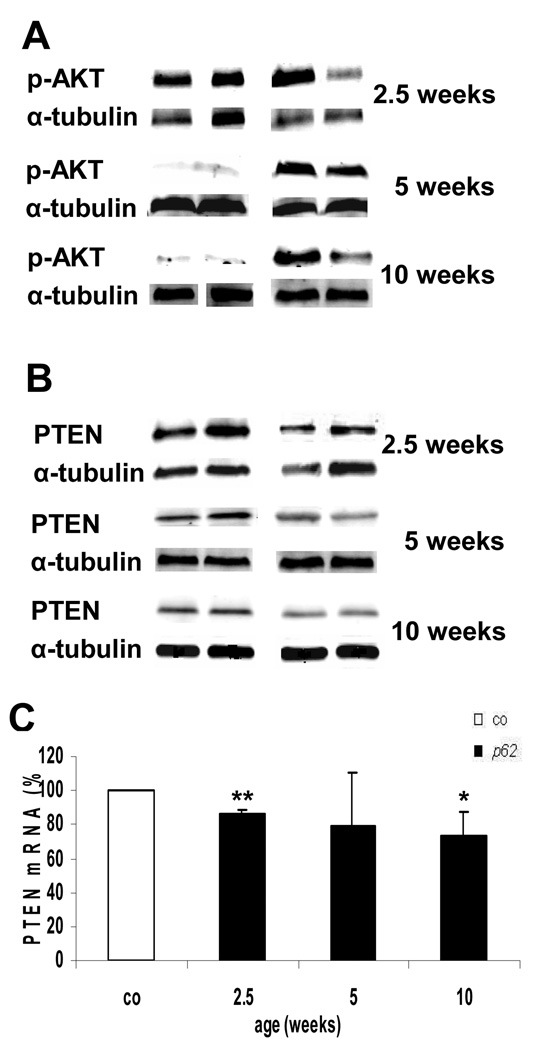
Fig. 6. Igf2 downstream target activation.
(A) pAKT and (B) PTEN at 2.5 (n=co:6/p62: 7), 5 (n=co: 4/p62: 5) and 10 weeks (n=co: 7/p62: 6). Protein normalized to α-tubulin. Representative blots are shown. (C) PTEN mRNA expression of 2.5 (n=co:8/p62: 13), 5 (n=co: 4/p62: 6) and 10 week (n=co: 8/p62: 12), mean percentages ± SEMs are shown. P<.01 (**) vs. controls of the respective age.

