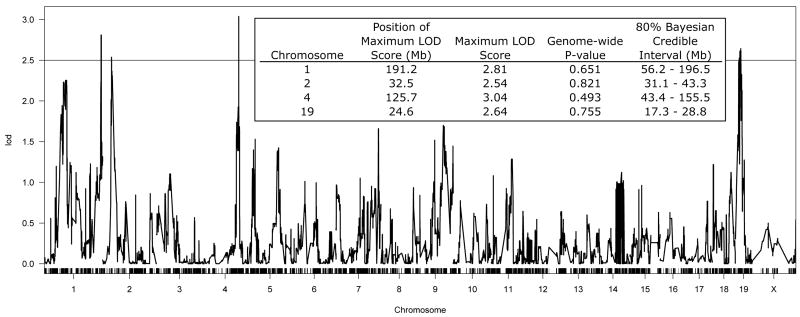
Figure 2. LOD Profile of QTL for Ethanol Consumption (DID) across LXS Panel and Summary of Suggestive QTL.
Strain means from Figure 1 were used in a weighted marker regression to identify QTL for DID. The figure insert includes further information on all peaks with a LOD score greater than 2.5.

