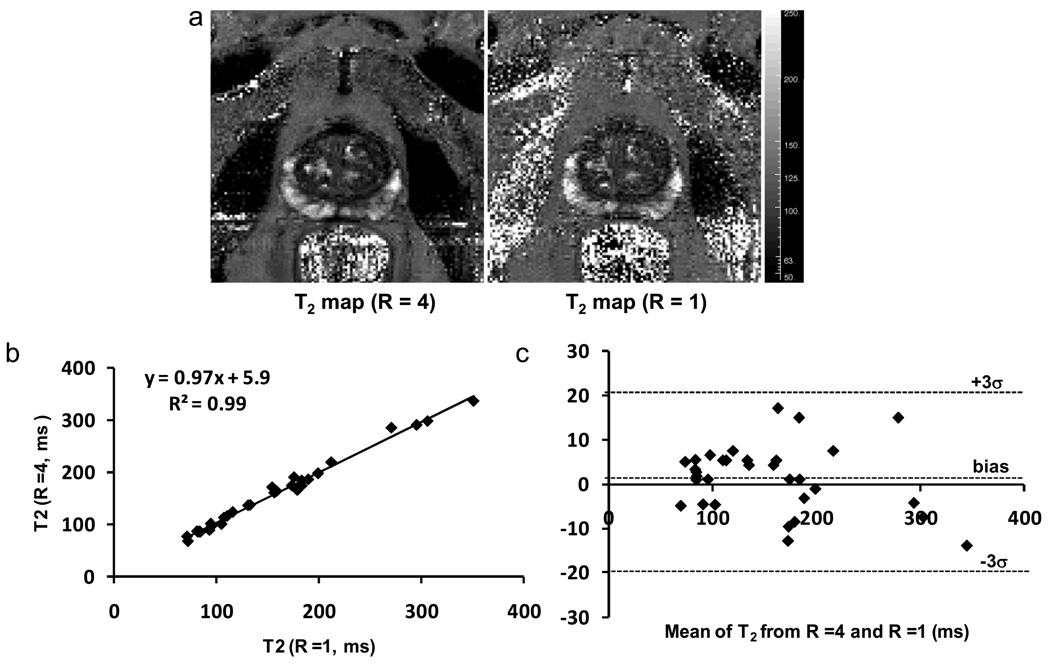
Figure 3.
T2 maps (a) acquired from the accelerated approach (R = 4) and the conventional unaccelerated approach (R =1) from a patient(59 yrs, PSA = 11.1), regression plot (b) and Bland-Altman plot (c) of the mean T2 values obtained with the accelerated T2 mapping technique and the conventional T2 mapping. The mean T2 values obtained with R = 4 demonstrated very good correlations (r = 0.99) with the mean T2 values obtained with the conventional sequence. The Bland-Altman plot confirmed the very good agreement between the regular and accelerated measurements.

