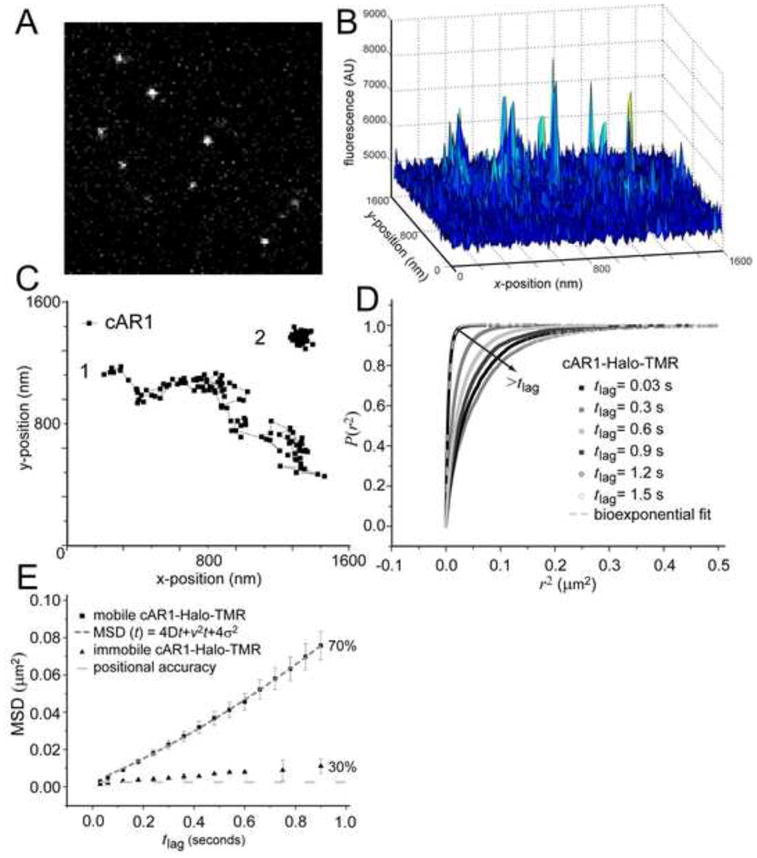
Figure 1. Analysis of cAR1 mobility.

(A) Image from a stack (movie M1, see supplemental material) showing signals form single cAR1-Halo-TMR molecules in the basal membrane of live Dictyostelium cells as imaged with Total Internal Reflection Fluorescence Microscopy (n=19 cells). (B) The 3D graph of the intensities of the single molecules. (C) Representive trajectories of two different dynamic behaviors, mobile (1) and immobile (2), of cAR1. (D) Cumulative probability distributions (P(r2)) of the square displacements (r2) of cAR1-Halo-TMR at different tlag. The PSD were described with a biexponential fit (dashed curve) giving two Mean Square Displacements (ri2(t)) and the fraction size (α) at each tlag. (E) MSD data of single cAR1 molecules versus tlag. The cAR1-Halo-TMR data for the immobile fraction (30% of the molecules) was close to the error in positional accuracy (light grey dashed line) 4σ2= 0.0025 μm2. The mobile fraction (n=59 trajectories) was described by a model describing diffusion with flow (grey dashed line). The fitting results were D=0.015 ± 0.002μm2/s and velocity of v= 0.16 ± 0.02 μm/s.
