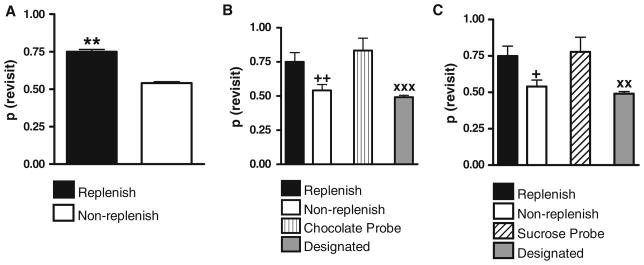
Fig. 4.
a Rats preferentially revisit the chocolate location when it is about to replenish. These data come from the last ten sessions of mixed testing of replenishment and non-replenishment conditions in Maze 1 and are referred to as the mixed baseline. **p = 0.02 difference between replenishment and non-replenishment conditions. b In the chocolate probe, rats revisited the corresponding chocolate location in Maze 2 at a higher rate when chocolate was unexpectedly replenished compared with the non-replenishment mixed baseline in Maze 1 (labeled Replenish and Non-replenish) and designated baseline in Maze 2 (labeled Designated). The probability of revisiting corresponding chocolate location in Maze 2 is labeled Chocolate Probe. The mixed baseline is reproduced from a to facilitate comparison with the chocolate probe. ++p = 0.005 difference between chocolate probe and non-replenishment mixed baseline; xxxp = 0.001 difference between chocolate probe and designated baseline. c In the sucrose probe, rats revisited the corresponding sucrose location in Maze 2 when sucrose was unexpectedly replenished compared with the non-replenishment mixed baseline in Maze 1 and designated baseline in Maze 2. +p = 0.03 (one-tailed) difference between sucrose probe and non-replenishment mixed baseline; xxp = 0.01 difference between sucrose probe and designated baseline. a–c Error bars represent 1 SEM

