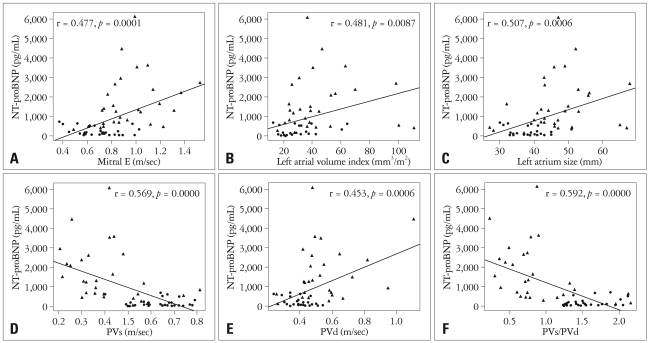
Fig. 1.
Scatter plots showing the correlation between plasma NT-proBNP level and Mitral E (A), left atrial volume index (B), left atrial size (C), PVs (D), PVd (E), and PVs/PVd (F). Group 1: patients with normal sinus rhythm, manifested by ●, Group 2: patients with atrial fibrillation, manifested by ▲. NT-proBNP: N-terminal pro-brain natriuretic peptide, PVs: pulmonary vein systolic velocity, PVd: pulmonary vein diastolic velocity, PVs/PVd: ratio of PVs/PVd.

