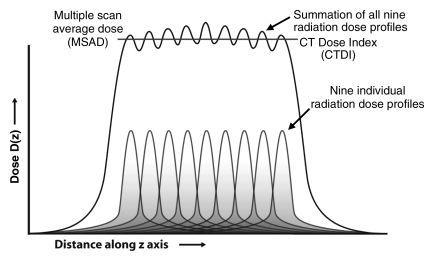
Figure 2b:
(a) Radiation dose profile along a line perpendicular to the scan plane shows a peak dose level at the center of the primary beam and long dose tails caused by scattered radiation. NT = nominal beam width. (b) The radiation dose profiles from nine adjacent transverse CT scans along a line perpendicular to the transverse scans, when summed, produce the MSAD profile. The value of MSAD is the average value of this profile over one scan interval in the central portion of the profile. (Reprinted, with permission, from reference 7.)

