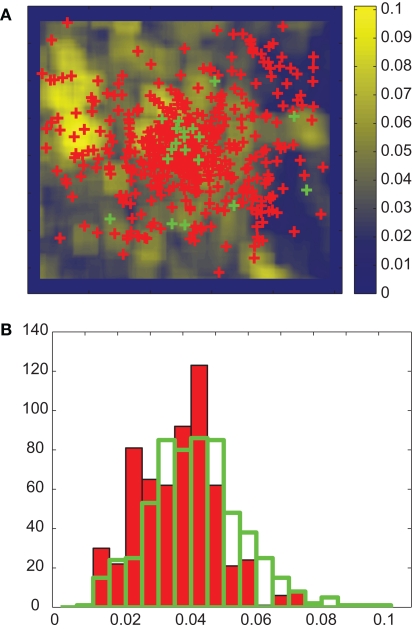
Figure 2.
Feature analysis. (A) Measured fixation locations of one participant (green) and corresponding control locations (red, see text for details) plotted on the B–Y color-contrast map of the image in Figure 1A. For each image and participant, the actual value is defined as the median feature value over all fixations. Control values are defined in an analogous manner. (B) The distribution of actual (opaque bars with green edge) and control (red bars) B–Y color-contrast for all participants and images in the NAT condition. The KS-test indicates that these two distributions are significantly different with p < 0.01. The effect size is 0.19. For presentation only, the distributions are binned using 20 bins.

