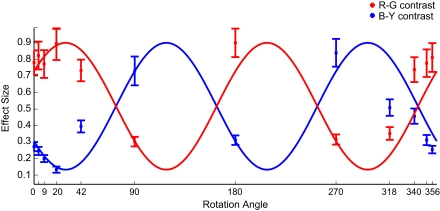
Figure 5.
Color-contrasts Experiment 2. Mean effect sizes (with SEM) for R–G (red marks) and B–Y (blue marks) contrast, calculated on 81 × 81 pixel patches, in the different color rotation conditions. The cosines reflect the hypothesis that the same image locations are fixated in all conditions, irrespective of its color-contrast. Their maximum is fitted to the largest effect size found, and the amplitude is the difference between the largest and the smallest effect size. The cosines are shifted by 34.5° to the right to correct for the asymmetry in image statistics. The labeling of tick-marks at the 4° and 351° condition are omitted for better readability.

