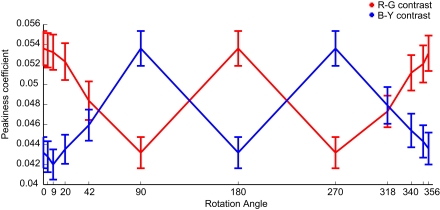
Figure 6.
Peakiness of color-contrasts. Mean peakiness values (with SEM) for R–G (red line) and B–Y (blue line) color-contrasts, calculated for the same patch size as Figure 9. There is a correlation of 0.93 between the mean peakiness and mean effect sizes for both color-contrasts.

