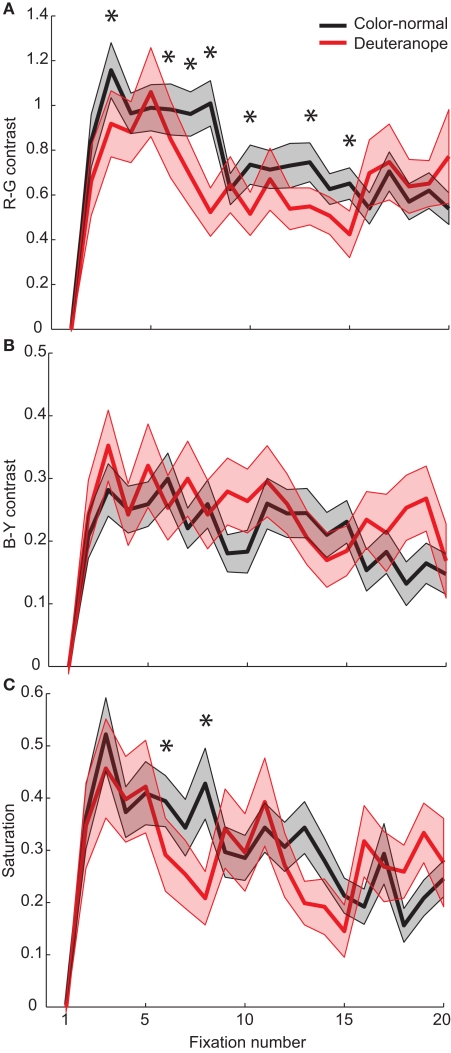
Figure 8.
Color features for each fixation. Effect sizes for the features R–G contrast (A), B–Y contrast (B), and Saturation (C). The shaded areas represent the SEM. Asterisks indicate significant differences between color-normal and deuteranope participants, determined by a two-sided Kolmogorov–Smirnov test (n1 = 330, n2 = 176).

