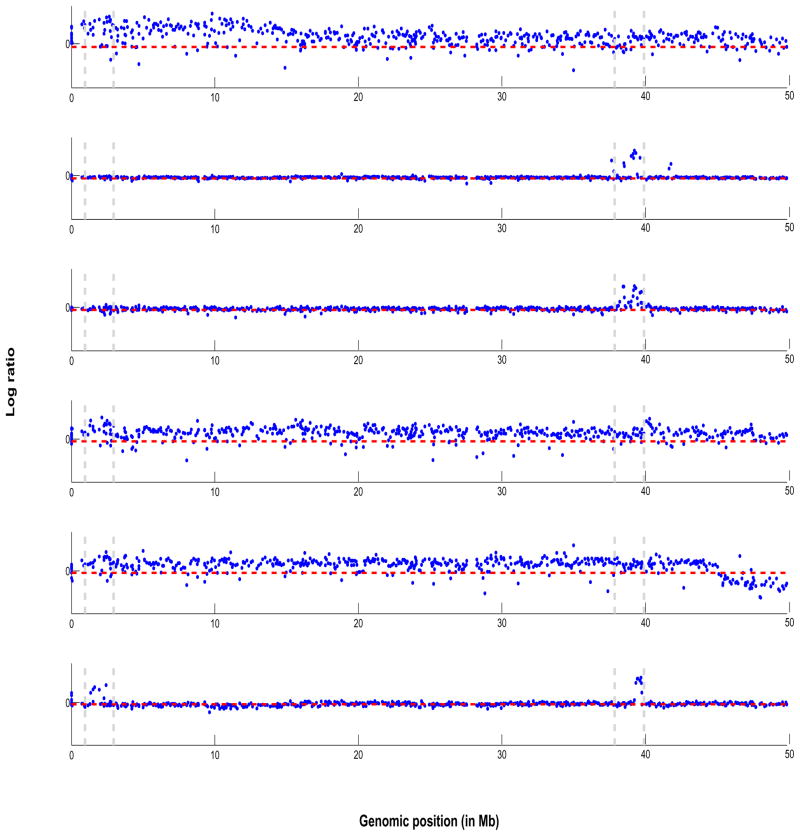
Figure 1.
Lung cancer data: plot of array CGH profiles from 6 samples from the lung cancer data set. On the vertical axis are plotted the log2 ratios against their genomic position in Mb on the horizontal axis for Chromosome 1. The horizontal dashed line in red indicate zero log2 ratio level. The parallel vertical dashed bars indicate common regions of shared aberrations that are of interest.

