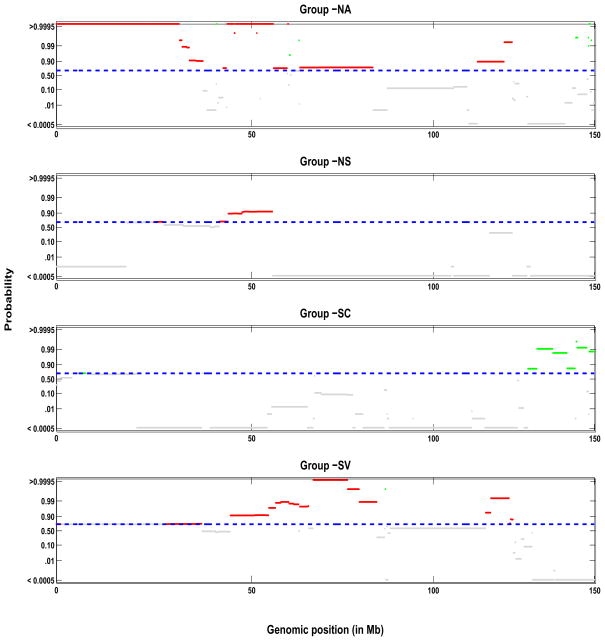
Figure 7.
Group profiles for chromosome 9: shown are the pointwise posterior probabilities of shared regions of aberration as a function of the genomic position, p+(x) and p−(x), for the four phenotypic groups: NA, NS, SC, and SV (top to bottom). The blue dotted lines indicate the threshold for flagging a location as significant, controlling the expected Bayesian FDR to be less than 0.10. The locations that show a gain in copy number are shown in green, losses are showin in red and neutral locations are shown in gray.

