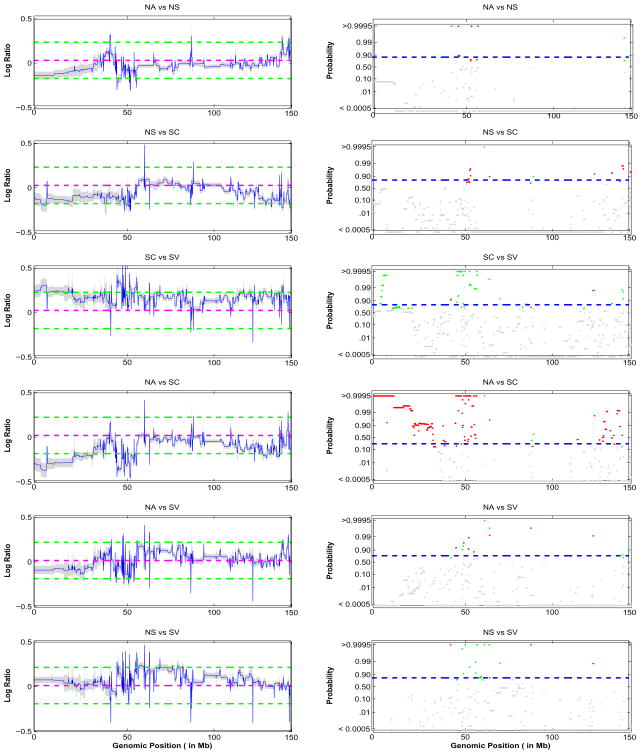
Figure 8.
Contrast of group mean profiles: the left column shows the pointwise differences of the population mean functions of the 4 cancer phenotypes: NA, NS, SC, and SV along with the 95% credible intervals. The green lines indicate the 1.15-fold difference between the mean profiles. The right column is corresponding pointwise posterior probability of a 1.15-fold difference. The blue dotted lines indicate the threshold for flagging a location as significant, controlling the expected Bayesian FDR to be less than 0.10. The locations that show a relative increase in copy number are shown in green, decrease in copy number in red and no difference are shown in gray.

