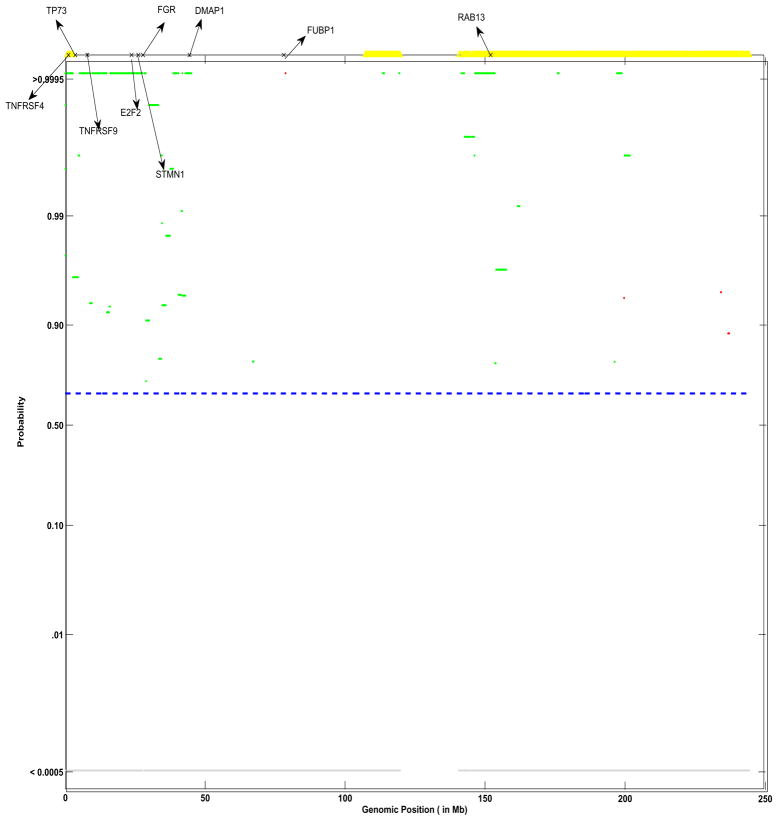
Figure 9.
Group profile for group SC: shown are the pointwise posterior probabilities of shared regions of aberration as a function of the genomic position, p+(x) and p−(x), for the phenotypic group SC. The blue dotted lines indicate the threshold for flagging a location as significant, controlling the expected Bayesian FDR to be less than 0.10. The locations that show a gain in copy number are shown in green, losses are shown in red and neutral locations are shown in gray. Also shown are significant genes identified to related to lung cancer. Marked in yellow are the corresponding locations identified as shared aberrations by the cghMCR algorithm.

