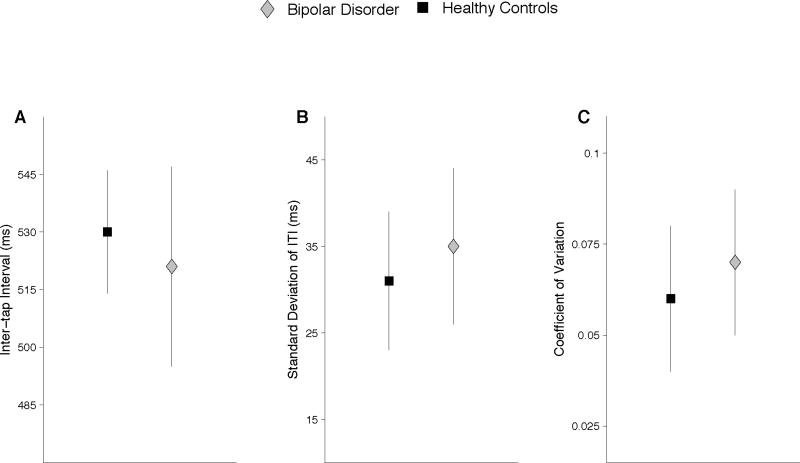
Fig. 1.
Tapping performance for healthy controls and bipolar disorder groups in the dominant index finger and alternating thumbs conditions. Panels A–C show the mean intertap interval, standard deviation of the intertap interval, and the coefficient of variation. The bipolar disorder group had a faster tapping rate and increased variability relative to controls.

