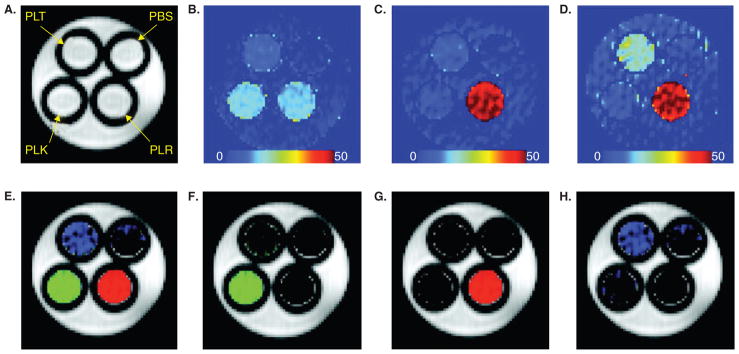
Figure 3. Multi-color images of CEST peptides using three different saturation frequencies.
The phantom shown consists of 1 mm tubes inserted into a 5 mm NMR tube, filled with 2.5 mg/ml peptides and buffer as outlined in (A) PBS = phosphate buffered saline; PLR = poly-L-arginine, PLK = poly-L-lysine, PLT = poly-L-threonine. (A) Proton density image. (B) magnetization transfer ratio asymmetry (MTRasym) (± 3.69 p.p.m.) image. (C) MTRasym (± 1.8 p.p.m.) image. (D) MTRasym (± 0.8 p.p.m.) image. (E) Merged image from the three label channels. (F) NH label from the difference between images in (B) and (D) after normalizing the maximum signal in the image. (G) NH2 channel from (C) after normalizing the maximum signal in the image. (H) OH channel from the difference between normalized images (C) and (D).
Reproduced, with permission, from McMahon et al. [39].

