
Figure 2.
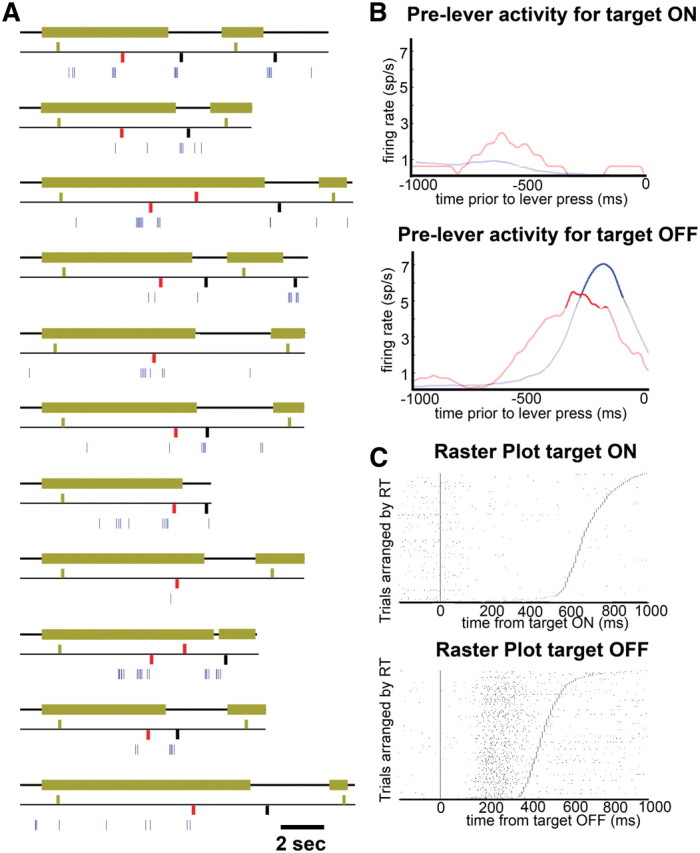
Sample cell in FEF. A, Activity of a single cell in FEF during the MIB task. Eleven individual trials are represented. The top trace of each trial represents the target; thick green line represents target ON, and thin black line represents target OFF. The middle trace represents lever presses, bars above the black trace represent a lever press signaling the appearance of the target, and bars below the black trace represent a lever press signaling the disappearance of the target. Green, black, and red bars indicate real appearances, real disappearances, and illusory transitions, respectively. The lower trace (blue) represents the spiking activity of the neuron; each tick corresponds to one action potential. B, Average activity of cell shown in A preceding lever responses indicating target ON (top) and target OFF (bottom). Blue and red traces indicate activity preceding real and illusory transitions, respectively. Dark traces indicate activity exceeding 2 SDs from the mean. C, Raster plot aligned to target ON (top) and OFF (bottom) at time 0 (blue vertical line), and sorted by reaction time, indicated by blue lines.