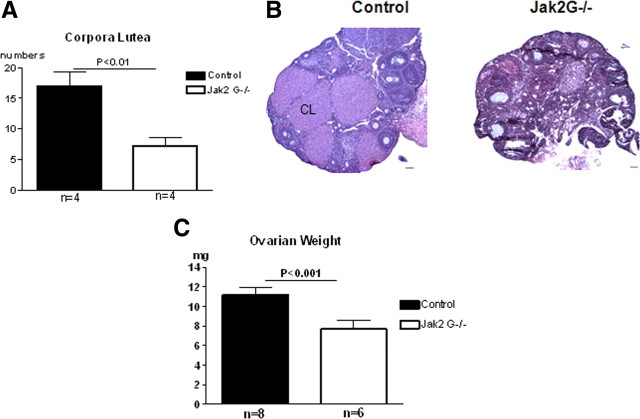
Figure 8.
Ovarian morphology. A, Ovary was sectioned at 7 μm and corpora lutea (CL) were counted every 10th section per ovary (n = 4 per group). B, 7 μm ovary sections with hematoxylin-eosin staining. CL was labeled in the control ovary. C, Ovarian weights (mg) of control and Jak2 G−/− mice (n = 8, control; n = 6, Jak2 G−/−). Values are mean ± SEM, and significant differences are noted with brackets above bars.

