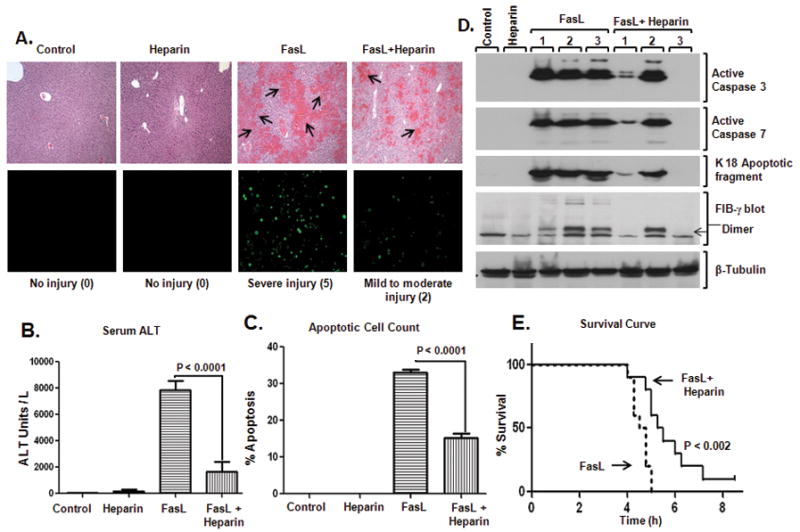
Figure 5. Pretreatment with heparin reduces FasL-induced liver injury.

(A) Heparin was administered to age/sex-matched mice followed by FasL injection (4h after heparin), and the extent of liver damage was assessed. H&E sections show hemorrhage formation (top) and TUNEL staining shows apoptotic cells (bottom). Three mice were used for each of the control and heparin-alone arms, while 7 mice were used for each of the FasL and FasL+heparin arms. Numbers in parenthesis reflect the injury score (see Experimental Procedures and Fig. S2). (B) Serum ALT, (C) % Apoptotic cell count, and (D) Biochemical analysis of the livers from the indicated treatments and controls are shown. Note that all measured parameters are significantly less in mice that received heparin prior to FasL. In panel D, each lane represents an independent liver, and tubulin is shown as a loading control. (E) Heparin or saline were administered to mice (10–12 week-old; n=10/group) followed by FasL-injection (4h after heparin/saline) and survival time (hours) was recorded.
