
Figure 1.
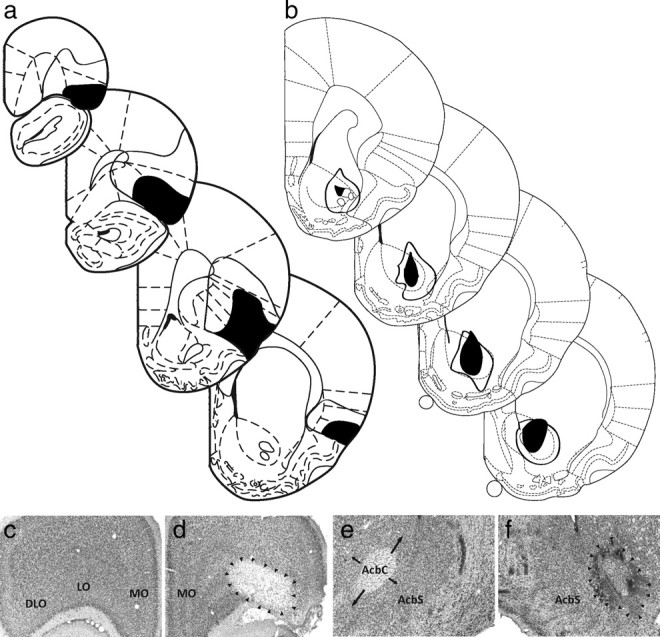
Histology. a, Minimum (black) and maximum (white) OFC lesion extent are shown for bregma +4.7, +3.7, +2.7, and +1.7 (adapted from Paxinos and Watson, 1998). b, Minimum (black) and maximum (white) VS lesion extent are shown for bregma +2.2, +1.7, +1.2, and +0.7 (adapted from Paxinos and Watson, 1998). c–f, Representative intact orbitofrontal cortex (c), lesioned orbitofrontal cortex (d), intact ventral striatum (e), and lesioned ventral striatum (f) are shown. DLO, Dorsolateral OFC; LO, lateral OFC; MO, medial OFC; AcbC, accumbens core; AcbS, accumbens shell.