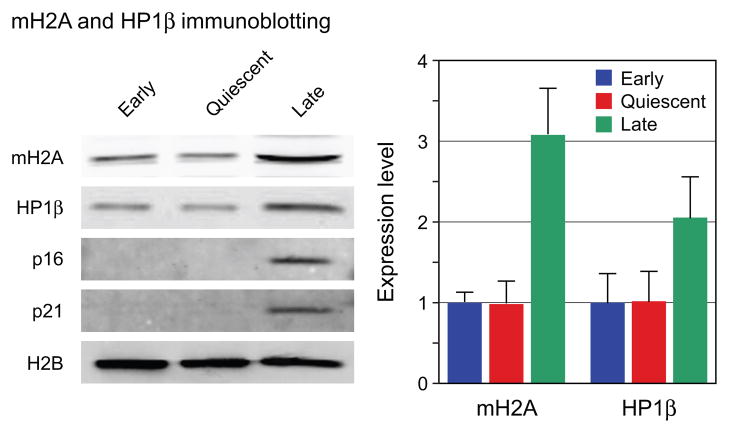
Fig. 3.
Immunoblotting analysis of total cellular extracts. Left panel: representative images from one experiment. Lanes were loaded for equivalent cell numbers. Note the clear upregulation of the cyclin dependent kinase inhibitors p16 and p21 in late passage cells, indicative of entry into cellular senescence. Right panel: immunoblots were quantified using the LI-COR Odyssey infrared imaging system. mH2A and HP1β levels were normalized to H2B levels detected in the same lane and are expressed as a ratio of mH2A or HP1β to H2B a.u. The values shown are the means of three separate experiments. Error bars indicate the SEM. The differences in expression between early and late cells are significant at p = 0.0032 and p = 0.042 for mH2A and HP1β, respectively, calculated using a two-tailed student's test.

