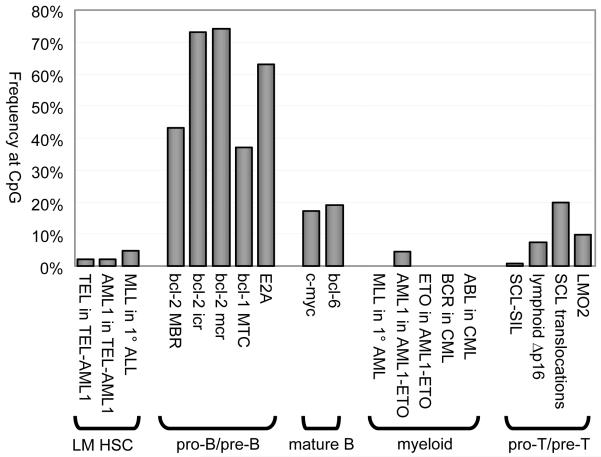
Figure 4. Frequencies of Breakpoints at CpG in Various Chromosomal Rearrangements.
Percentages of breakpoints at CpGs are plotted for various chromosomal rearrangements, organized by cell lineage and stage of development when the rearrangement occurs. Frequencies for pro-B/pre-B rearrangements far exceed those from other lineages and stages.

