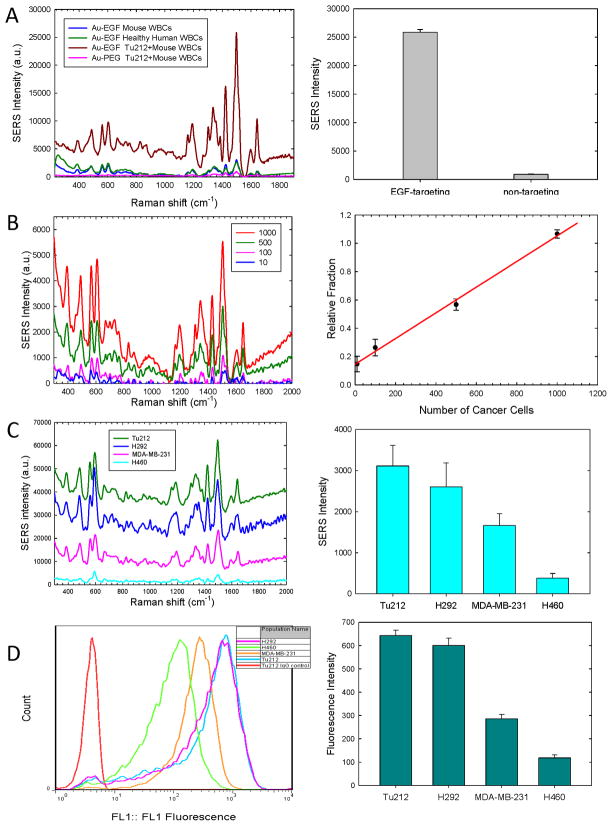
Figure 2. Detection sensitivity and specificity.
(A) Left SERS signals from EGF-SERS (brown) and non-targeted SERS (pink) nanoparticles in Tu212 cells (1×10⁴) spiked in 2ml mouse blood. Controls tested non-specific binding of EGF-SERS nanoparticles to healthy blood cells of mouse (blue) and human (green); Right: Comparing the SERS intensities for targeted and non-targeted nanoparticles in (A). (B) Left: SERS spectra of 10, 100, 500, and 1000 Tu212 cells labeled with EGF-SERS tags in 1×10⁷ WBCs. Right: The correlation between relative SERS-signal intensity and the number of spiked Tu212 cells. (C) Left: SERS spectra of 1×10⁴ Tu212, MDA-MB-231, H292, H460 cells in 5×10⁶ WBCs. (D) Left: Examination of EGFR-expression by FACS. Right: Various levels of EGFR-expression measured by SERS (C) and fluorescence (D) intensities. Error bars represent the standard deviation of three replicates.

