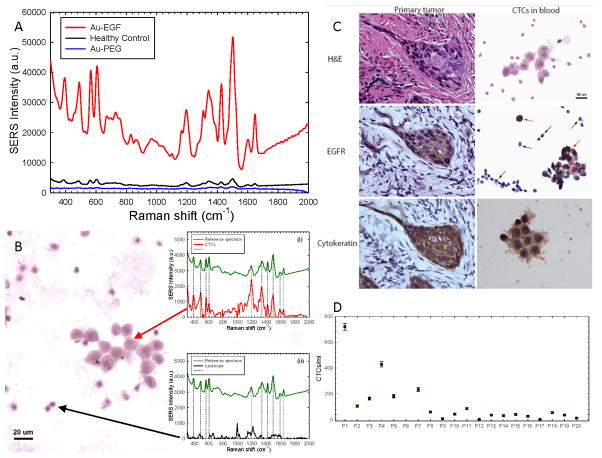
Figure 3. Detection of CTCs in patients’s blood samples and IHC staining for EGFR and cytokeratin.
(A) Blood sample from Patient-1 incubated with both targeted (red) and non-targeted (blue) nanoparticles. Blood samples from three healthy donors were tested as controls using EGF-SERS tags (black). (B) Image of a cluster of CTCs stained with hematoxylin. Insets: Single-cell SERS spectra of CTC (i) and WBC (ii) recorded from the area indicated by the red and black arrow, respectively. (C) Left: Representative IHC images of primary tumor from Patient-1, stained with H&E, anti-EGFR, and pan-cytokeratin antibody. Right: Representative images of CTCs (red arrows) and hematologic cells (black arrows) from Patient-1’s blood sample. (D) CTC counts in peripheral blood samples from 20 SCCHN patients.

