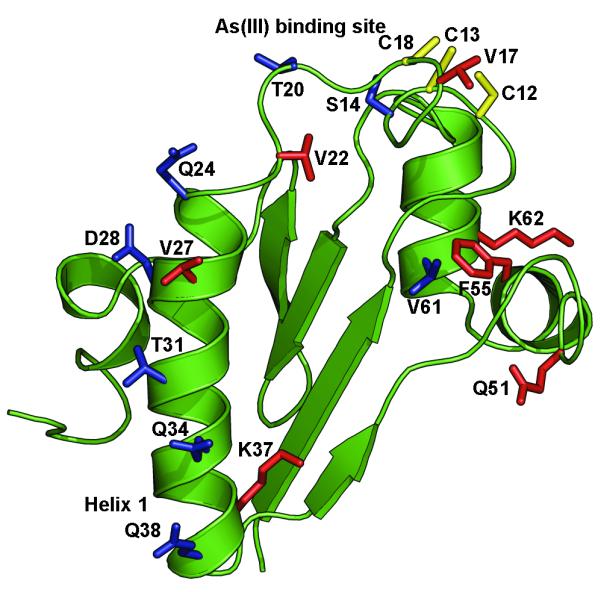
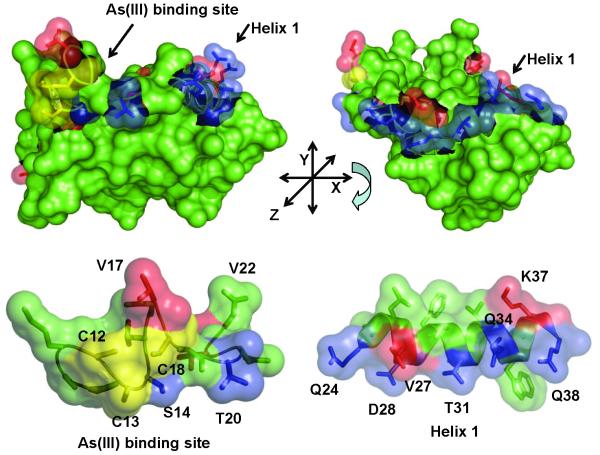
Fig. 5. Localization of mutations on the ArsD structure.

A. Cartoon of the ArsD structure in which the metalloid binding site was modeled (Ye et al., 2010) showing the location of residues mutated in this study. B. Residues mutated in this study are identified on the surface of ArsD. (a) Surface view showing the metalloid binding site; (b) the view was rotated along the x-axis to show the surface of helix 1. (c) and (d) show enlarged semi-transparent views of the metalloid binding site and helix 1 allowing visualization of the individual mutated residues. Residues in which mutations that increase interaction with ArsA are shown in blue. Those that result in decreased interaction with ArsA are shown in red. The cysteines of the metalloid binding site are shown in yellow.

