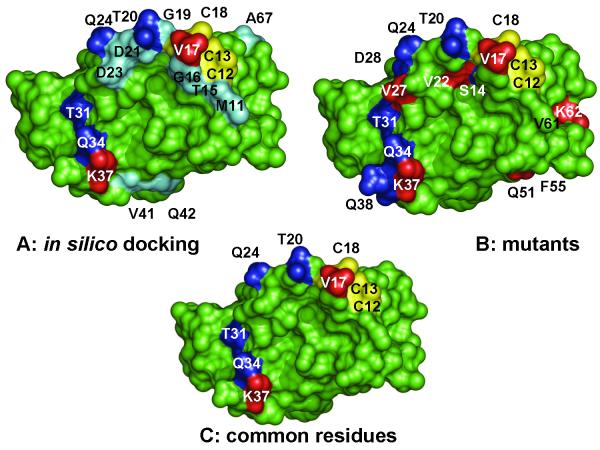
Fig. 6. Comparison of ArsA residues identified from in silico docking with mutagenesis.
A. A model of ArsD interacting with ArsA was generated by in silico docking (Ye et al., 2010). ArsD residues predicted to be within of residues in ArsA are identified. B. Residues in which mutations that affect interaction with ArsA are identified. C. Residues common between the docking model and the results of mutagenesis are identified. In each case residues in which mutations that increase interaction with ArsA are shown in blue. Those that result in decreased interaction with ArsA are shown in red. The cysteines of the metalloid binding site are shown in yellow. Residues predicted from modeling to be near ArsA residues but which were not found in mutants are shown in cyan. Structural models were rendered using PYMOL (DeLano, 2001) (http://www.pymol.org).

