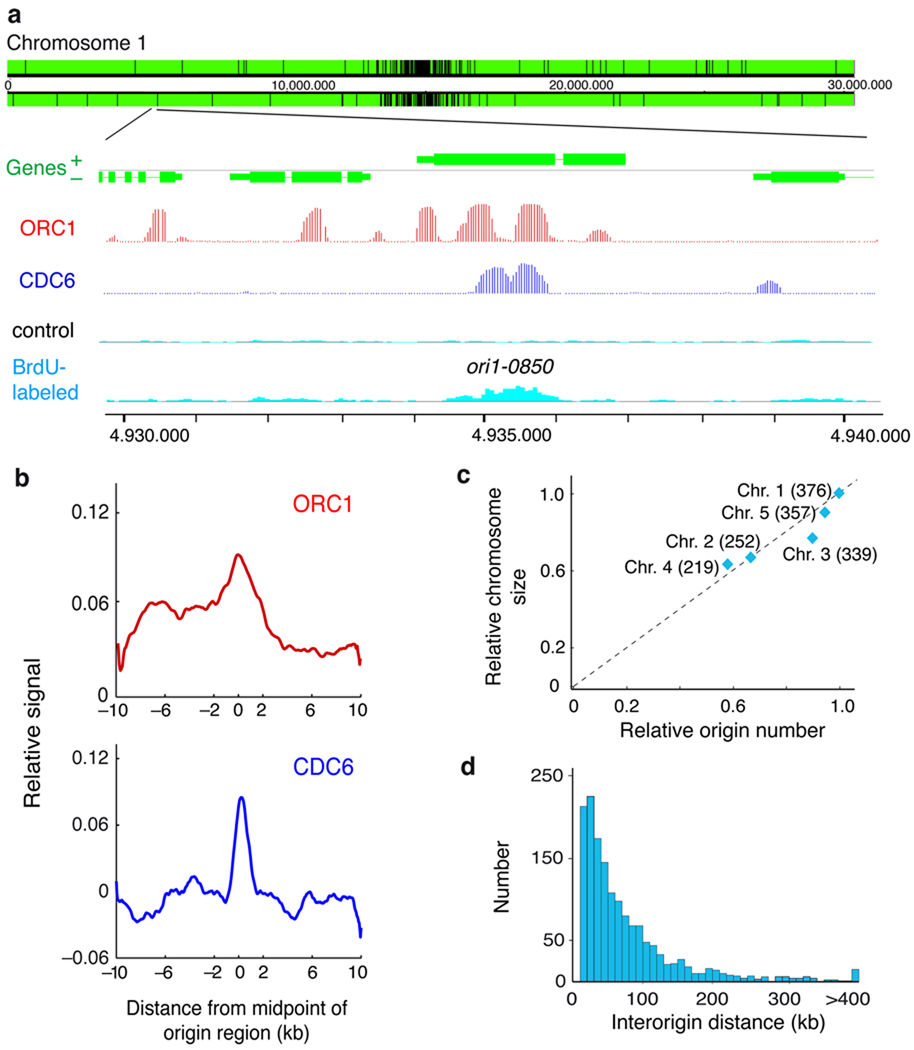
Figure 1. Identification of DNA replication origins in the Arabidopsis genome.
(a) Representative genome-browser view of a region in chromosome 1. Genes (green) transcribed from each strand are shown along the chromosome above and below the position scale. The panels shown in the lower part of the figure correspond to an enlarged region containing a replication origin, determined as a region enriched for BrdU-labeled DNA strands (light blue) relative to the unlabeled control DNA (black), together with the ORC1 (red) and CDC6 (dark blue) binding patterns (posterior probabilities for ORC1 and CDC6 data sets). Origins, e.g. ori1-0850 shown here, are named based on their chromosomal location (ori1- through ori5-) followed by the four digits that indicate the origin number within each chromosome. They are named consecutively starting at the left tip of each chromosome, i.e. for chromosome 1 where we identified 376 origins, the leftmost origin is ori1-0010 and the rightmost one is ori1-3760. (b) The pattern of ORC1 and CDC6 binding over origin regions was obtained by plotting their relative binding signal ±10kb from the origin region midpoint (0) using 50bp-sliding windows (smoothed). The p-values (two-sided) of the difference in the ChIP-chip signals in origins (midpoint ± 300bp), using a two-tailed Welch test, were 7.25e-6 and 1.29e-10 for ORC1 and CDC6, respectively. (c) Number of origins relative to chromosomal size. Chromosome size (relative to chromosome 1) was plotted against the number of origins identified in each chromosome (relative to origin number in chromosome 1). The number of origins identified in each chromosome is indicated in parenthesis. (d) Distribution of interorigin distances, measured as the distance between the midpoints of two contiguous origins (median = 51.1kb; average = 77.2kb; s.d. = 83.4kb).

