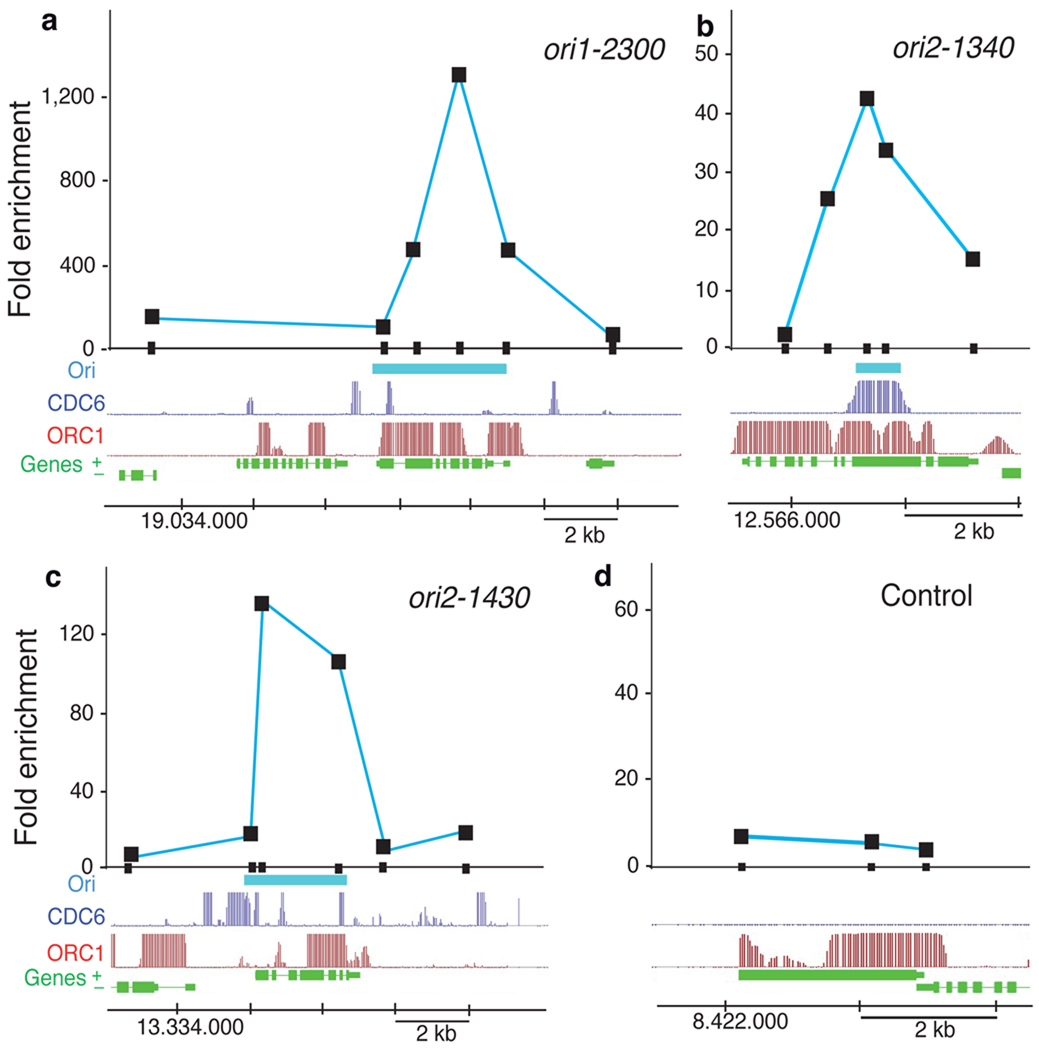
Figure 2. DNA replication origin activity determined by nascent DNA strand abundance.
(a-d) Several putative origin-containing regions were chosen for detailed measurement by real-time PCR of nascent strand abundance in a sample of short DNA molecules containing an RNA primer at their 5’end (see Methods). The genomic region under study is indicated at the bottom of each panel and shows the location of genes (green), the ORC1 binding (red) and CDC6 binding (dark blue) signals, and the putative origin location (light blue), defined by direct sequencing of the BrdU-labeled DNA sample (see Methods). DNA fragments (~200bp in length) amplified by primer pairs scanning each region are indicated by the small black rectangles on the X-axis. The coordinates in each chromosome are also indicated at the bottom of each panel. Results correspond to PCR amplifications using fraction #5 (see Methods). (a-c) Data for origins ori1-2300, ori2-1340 and ori2-1430. (d) Data for a region used as a negative control around gene at4g14700 that lacks BrdU-labeled DNA sequences.

